Running Meta's Muse Glimmer 30B on a 24 GB MacBook Air M4
What I did
I wanted to see if Meta’s newly released Muse Glimmer 30B could actually run on my own machine — a MacBook Air M4 with 24 GB of unified memory. No cloud GPU, no rented compute, just the laptop I already have.
This is a first attempt at local LLM benchmarking for me, so I kept the scope small: get it loaded, and measure three things well.
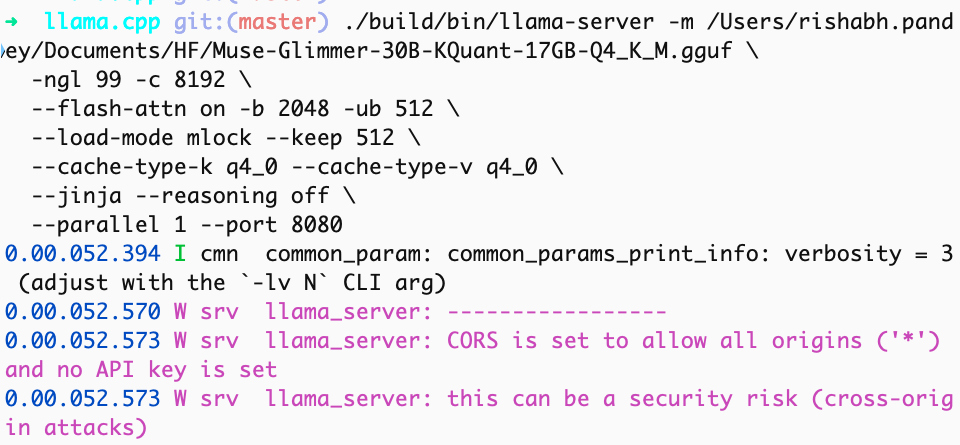 llama-server loading the model and coming up on port 8080, n_ctx_slot = 8192
Why llama.cpp
I needed a runtime with confirmed Metal support on Apple Silicon and a build process I could trust to actually work end to end. llama.cpp fit that — native Metal backend, no extra compile flags, and a single cmake build gets you a working server.
One thing worth flagging for anyone trying to reproduce this: release binaries don’t work. The tagged llama.cpp release rejects the model with unknown model architecture: 'muse-glimmer'. Support only exists on master — I built commit 22397c31a (build b10881).
I also hit one CLI breaking change worth noting: --mlock has been removed from recent builds in favor of --load-mode.
1
error: invalid argument: --mlock
Fixed by swapping to --load-mode mlock instead. Small thing, but it’ll stop anyone else cold if they copy an older command from a blog post.
Why GGUF
GGUF is llama.cpp’s native model format, so the format choice followed directly from the runtime choice — not a separate decision. Meta ships a pre-quantized GGUF build of Muse Glimmer at 16.8 GB (Muse-Glimmer-30B-KQuant-17GB-Q4_K_M.gguf), which is what made this runnable at all on 24 GB of unified memory in the first place. The raw BF16 weights are closer to 60 GB — nowhere close to fitting on this machine, in any format.
Why only 3 tests
I ran three things, on purpose, not because I ran out of time:
- Does it load, and does it hold at a normal chat exchange? — the baseline. If this fails, nothing else matters.
- Decode speed — how fast it generates once it’s talking. This is the number that governs whether the model feels usable for back-and-forth chat.
- Time to first token on a long prompt — how long you wait before it says anything at all. This is a completely different bottleneck from decode speed, and it’s the one that decides whether this machine could plausibly run something like a document-summarization or agent workflow, versus only being good for short questions.
Those three numbers together tell you almost everything about whether a model is usable on a given machine, without needing to test vision, speculative decoding, or anything else. Those are follow-ups, not part of this post.
Results
1. It loaded, and answered
Test: send one short chat completion request and confirm the server responds — the baseline check that the model is actually usable at all.
1
2
3
curl -s http://127.0.0.1:8080/v1/chat/completions \
  -H "Content-Type: application/json" \
  -d '{"messages":[{"role":"user","content":"Reply with exactly: ok"}],"max_tokens":600}'
1
2
{"choices":[{"finish_reason":"stop","message":{"content":"ok", ...}}],
 "timings":{"prompt_n":61,"prompt_per_second":21.79,"predicted_n":101,"predicted_per_second":6.17}}
With ~16.8 GB of weights against 24 GB total memory, and --parallel 1 -c 8192, the model loaded cleanly and n_ctx_slot = 8192 confirmed the full context window survived single-slot mode.
One thing worth noting from this first response: I asked for exactly “ok” and got two characters back — plus 46 words of visible reasoning debating punctuation before answering. That’s the model’s trained reasoning behavior showing up even on trivial prompts, and it’s why every test after this used max_tokens: 500+ — a low cap would look like model failure when it’s actually the model thinking out loud before it answers.
2. Decode speed
Test: four back-to-back completions on a fixed short prompt (“Explain what a KV cache is”), 90 seconds apart to let the fanless chassis cool between runs, first run discarded as warmup.
1
2
3
4
5
6
7
for i in 1 2 3 4; do
  curl -s http://127.0.0.1:8080/completion \
    -H "Content-Type: application/json" \
    -d '{"prompt":"Explain what a KV cache is.","n_predict":128}' \
  | python3 -c 'import sys,json; t=json.load(sys.stdin)["timings"]; print(t["predicted_per_second"])'
  sleep 90
done
1
2
3
4
6.214334855763821
6.146042355233117
6.07180913521374
6.192792252982683
| Run | tok/s |
|---|---|
| 1 (warmup, discarded) | 6.21 |
| 2 | 6.15 |
| 3 | 6.07 |
| 4 | 6.19 |
Median: 6.15 tok/s (runs 2–4).
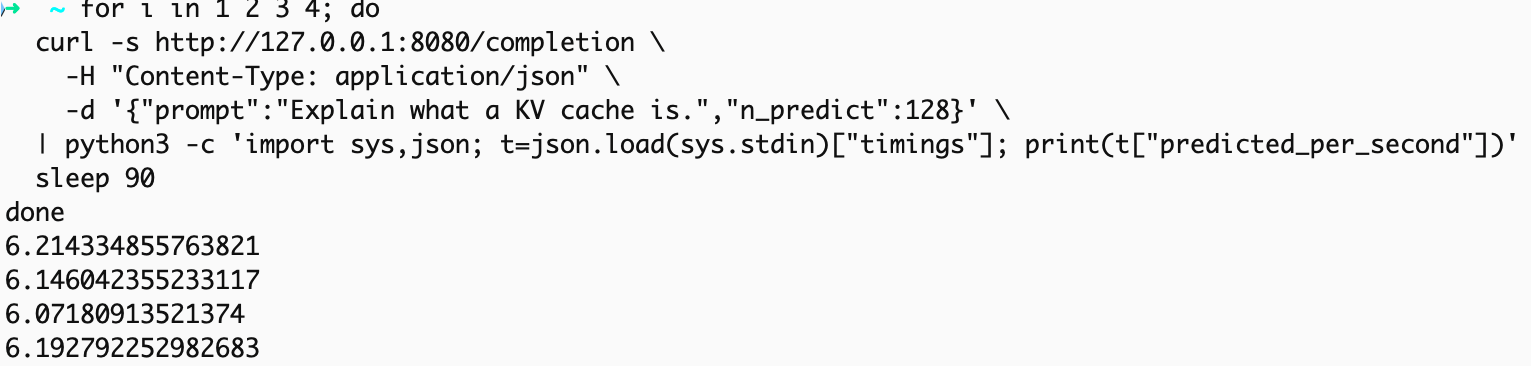 tok/s across four runs — run 1 discarded as warmup
Memory pressure during this window:
1
2
3
Pageins: 2466069
Pageouts: 4394
System-wide memory free percentage: 14%
Stable — no swap spiral, just a fully-loaded machine sitting at 14% free.
3. Time to first token on a long prompt
Test: feed the server a full-length article and measure how long it takes before the first output token appears — a completely different bottleneck from decode speed, and the one that actually matters for document or agent-style workloads.
I first tried the full raw Kubernetes Wikipedia article (~6,000 words), which tokenized to 9,461 tokens — over my 8192 context limit:
1
error: request (9461 tokens) exceeds the available context size (8192 tokens), try increasing it
Clean rejection, no crash. That’s a real data point on its own: at -c 8192, this machine’s ceiling for a single request sits right around 8,000 tokens.
 Clean rejection once the prompt exceeded n_ctx_slot
Trimmed to the first 4,000 words (5,499 tokens after tokenization), it completed:
1
2
3
prompt eval time = 128890.09 ms / 5499 tokens (42.66 tokens per second)
eval time = 25529.64 ms / 128 tokens (4.97 tokens per second)
total time = 154419.73 ms / 5627 tokens
~129 seconds to first token, on a 5,499-token prompt.
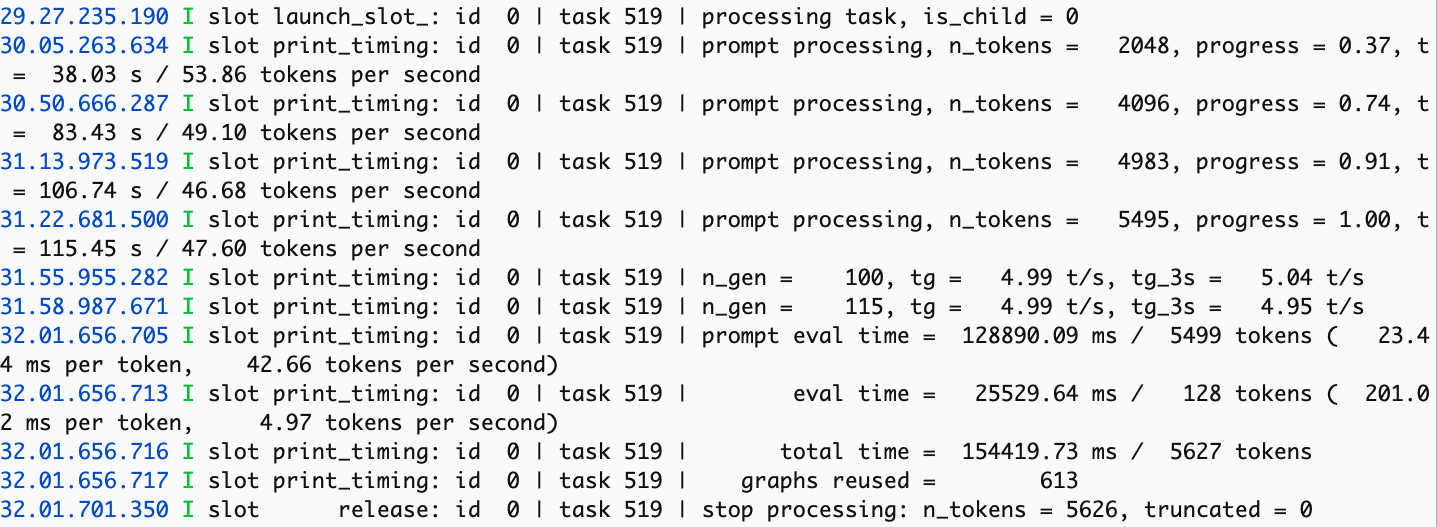 Server timings for the 5,499-token summarization request
The server log also showed prefill slowing down as the prompt filled the context, not staying flat:
1
2
3
4
n_tokens =   2048, t =  38.03 s / 53.86 tokens per second
n_tokens =   4096, t =  83.43 s / 49.10 tokens per second
n_tokens =   4983, t = 106.74 s / 46.68 tokens per second
n_tokens =   5495, t = 115.45 s / 47.60 tokens per second
53.86 tok/s early, down to 47.60 tok/s by the end of the prompt.
Observations
- The model loads and runs on 24 GB, full stop. That was the first open question and it’s answered — no OOM, no crash, stable memory pressure throughout.
- Decode speed (~6.15 tok/s short prompt) is fine for chat, rough for anything longer. Each short reply takes a handful of seconds. Once context grows to ~5,500 tokens, decode drops to ~5 tok/s — generation gets slower as context fills, not just prefill.
- Time-to-first-token is the real cost, not decode speed. ~129 seconds of silence before the first word of a summary appears is the number that actually determines whether this setup works for a document or agent workflow. Short chat exchanges feel fine; long-context tasks don’t.
- There’s a hard context wall at
-c 8192. Anything over ~8,000 tokens gets rejected outright rather than silently truncated, which is actually the safer failure mode — you know immediately instead of getting a response built on a cut-off prompt. - The raw
/completionendpoint leaks the model’s internal scaffolding (<|start|>assistant to=self<|message|>chain-of-thought markers) into the output. The templated/v1/chat/completionsendpoint handled this cleanly. Use the templated endpoint for anything user-facing. - I didn’t see thermal throttling across four runs on a fanless chassis — decode stayed in a 6.07–6.21 band. I expected some decay and didn’t see it; four runs may just not be enough to trigger it.
This was a first pass at benchmarking a local model, and I’m sure there’s room to tighten the methodology.